CALCULATION OF ECOLOGICAL AND ECONOMICAL PAYBACK
CALCUL POUR DÉTERMINER LA RENTABILITÉ ÉCOLOGIQUE ET ÉCONOMIQUE.
English:
The economical and ecological payback of wind farms is discussed on these pages.
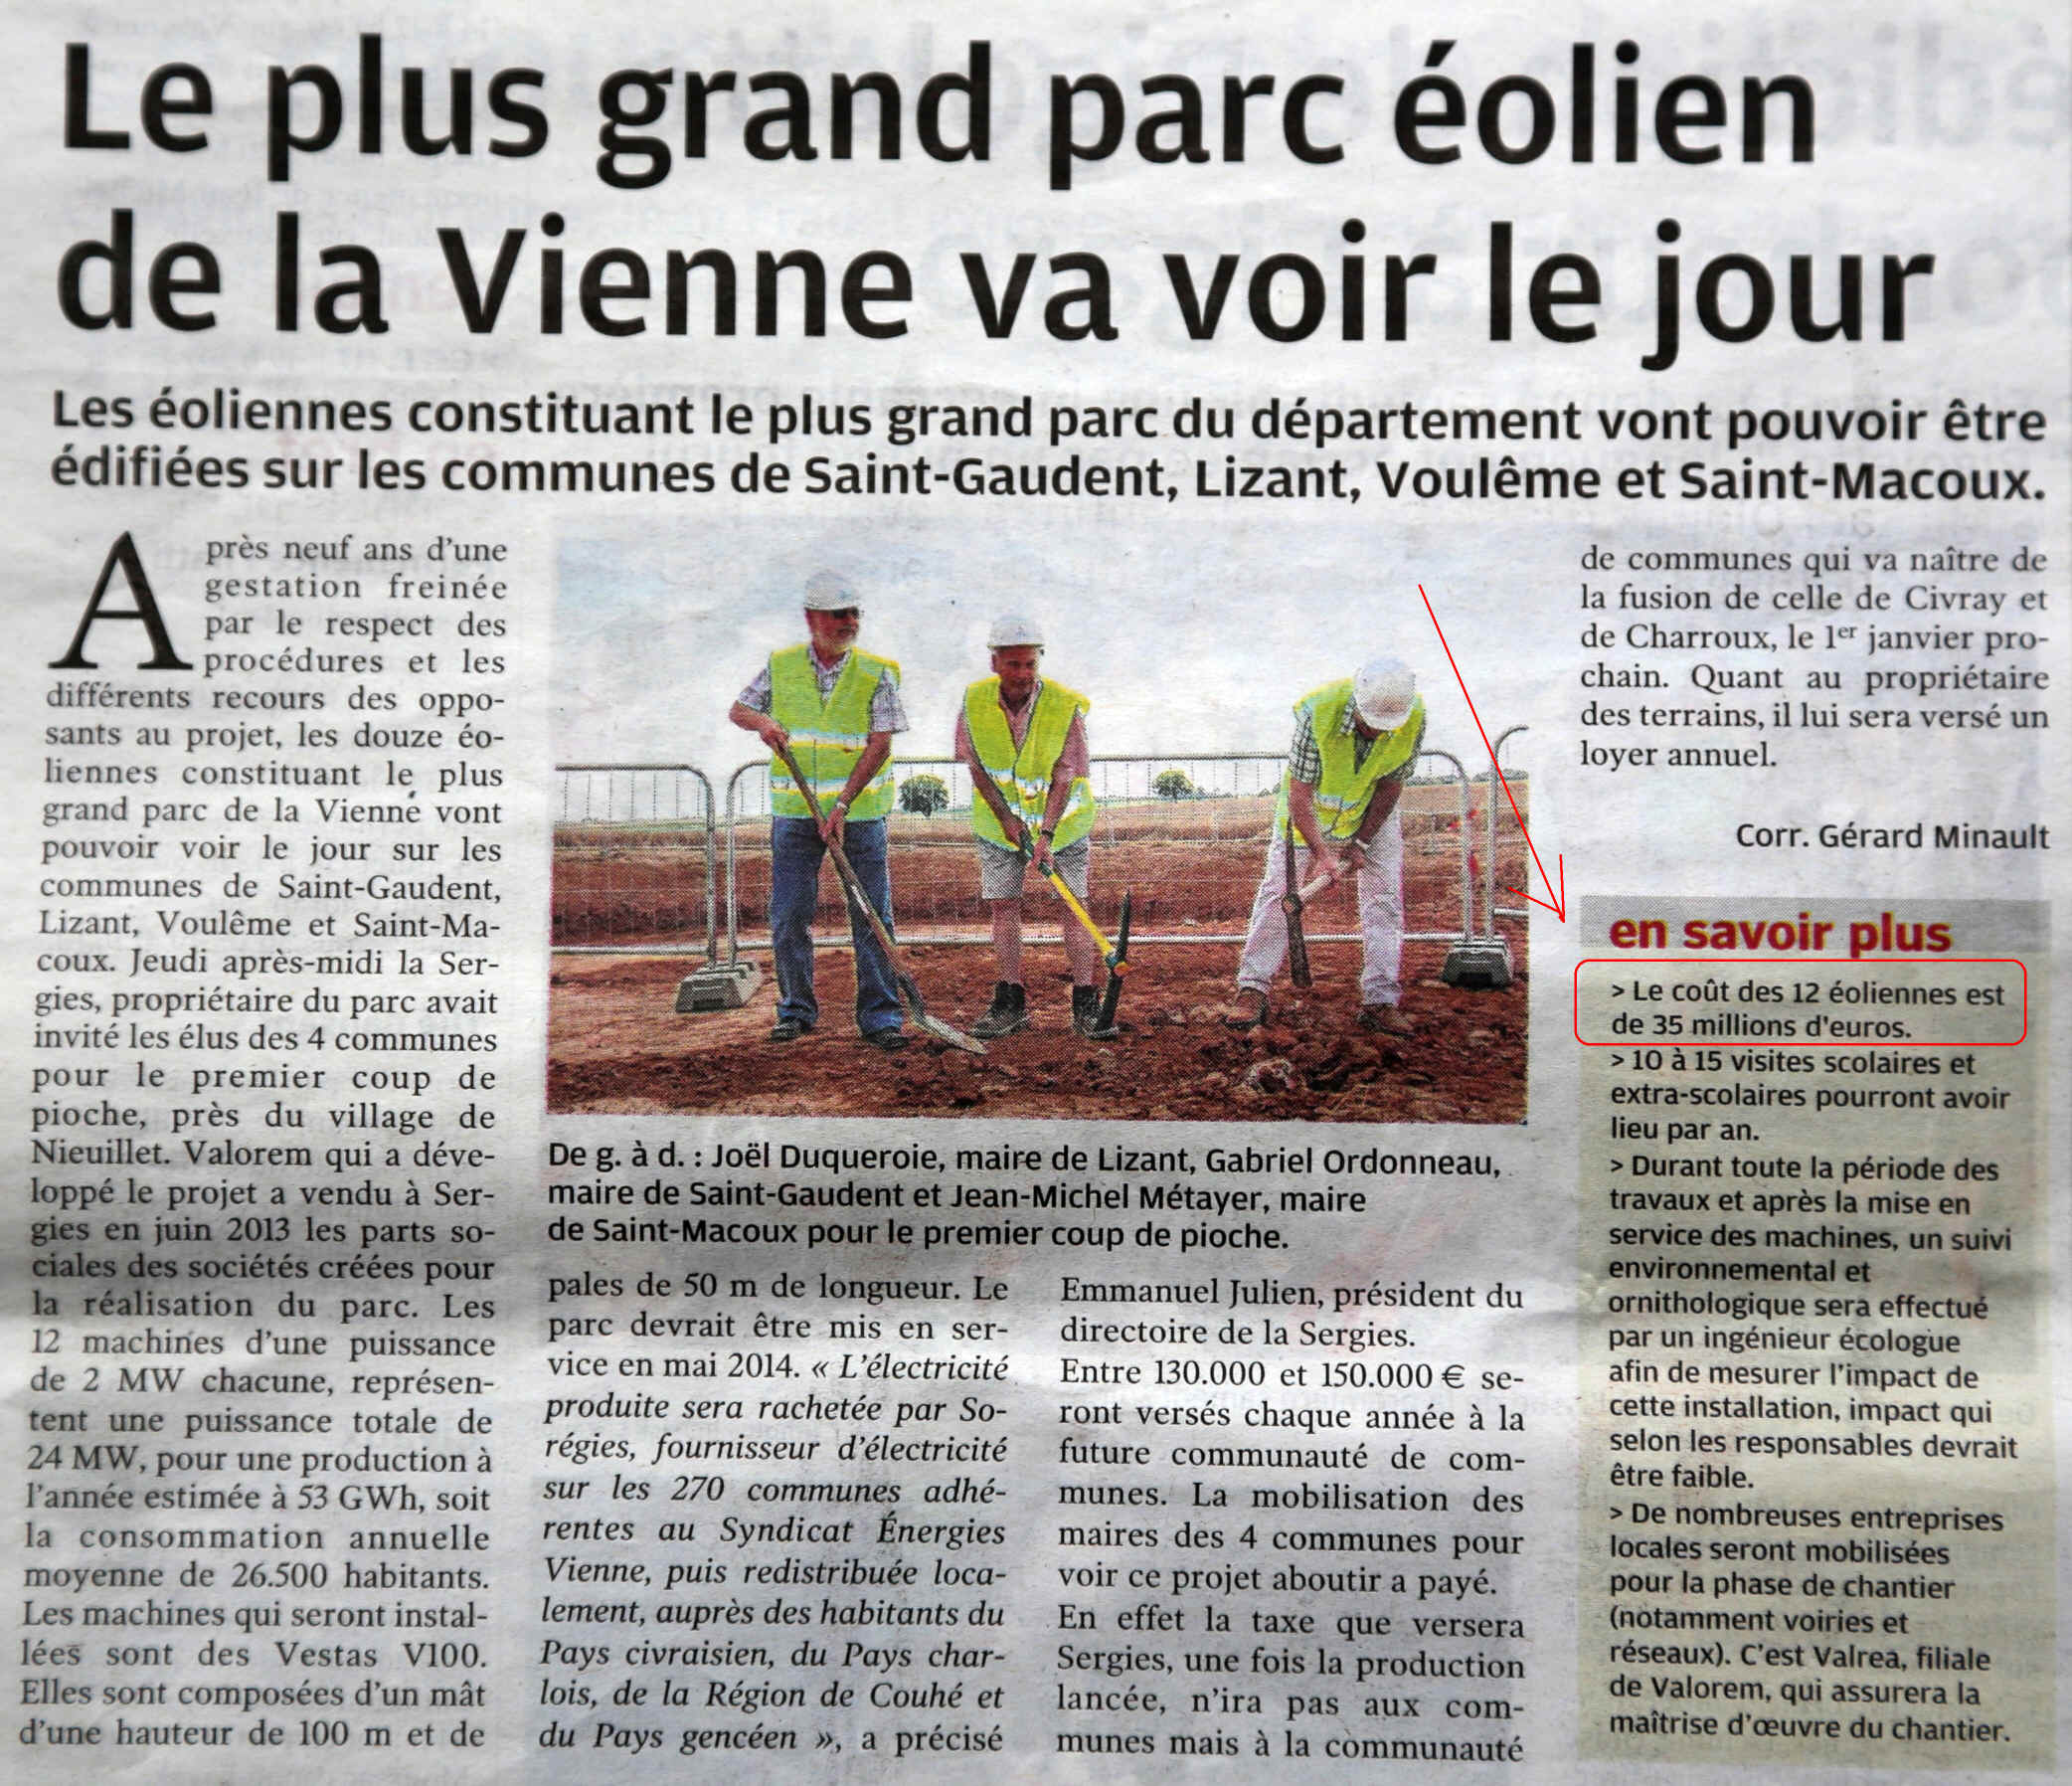
It is demonstrated that wind farms built in regions of low wind regimes, as is
the case for the south of the Vienne in France, are not profitable in both
terms. Indeed these aero generators will only produce electricity during
high wind meteorological conditions, that is in times when most all of the
already installed wind farms throughout Europe will also produce electric
current, at times when there is therefore an over supply of electricity.
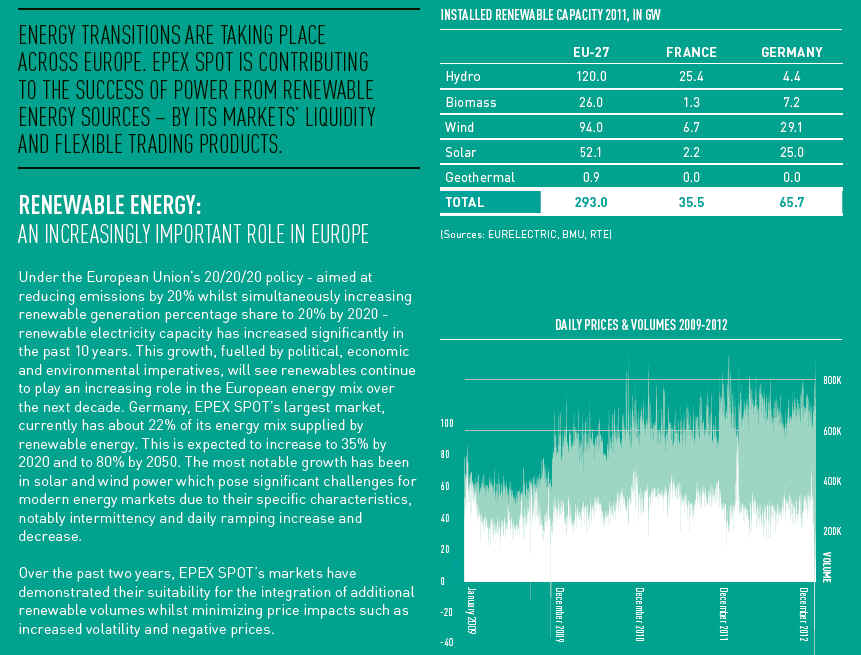
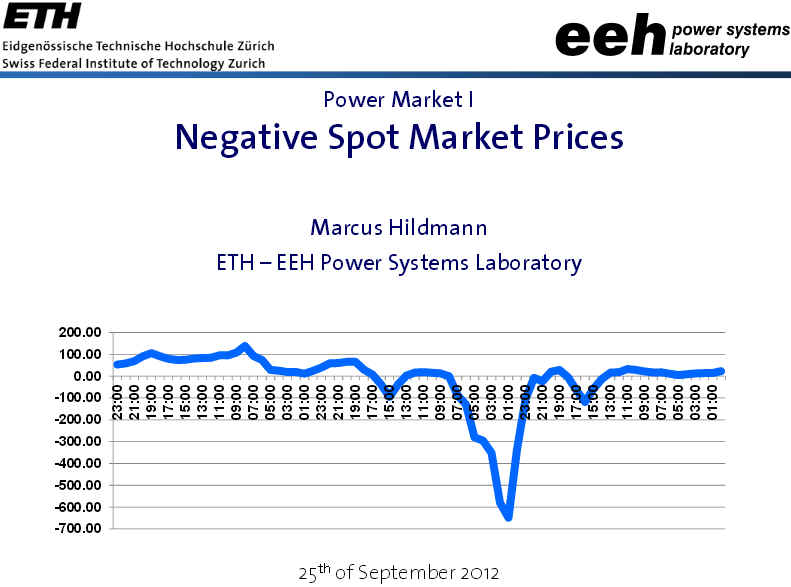
Several studies have indeed shown that there is a strong correlation between
meteorological high wind conditions and the decay of the electricity prices at
the European electric energy spot market EPEX. The presently introduced ecolo -
monetary model permits in addition to calculate the percentage of secondary
energy produced by such a badly placed "renewable" energy installation
(secondary energy is the part of the energy production of an energy generator
which only paying back the energy spent/wasted for the planning, building,
operation/maintenance, de-construction and remediation of the installation
during its full life time).
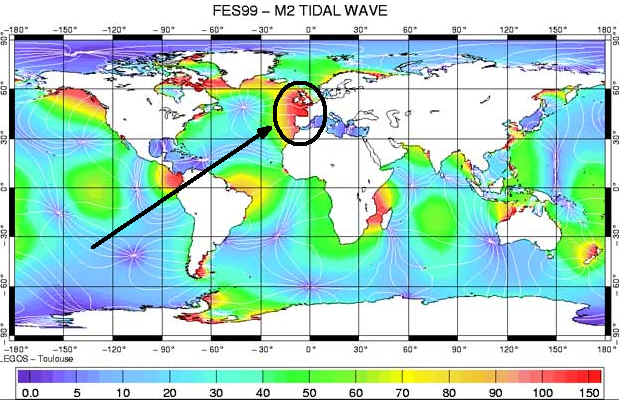
It is finally demonstrated that wind
farms are indeed a very bad choice, particularly for a country like France which
is placed in a region of particularly pronounced underwater see currents! The
main reason is the huge difference of the density of water when compared to air
(wind) of a factor of over 850 and the energy production of a turbine is of
course proportional to the density of the energizing fluid. One underwater
turbine can therefore produce as much energy as 850 wind turbines of the same
size and underwater currents are in addition steady and occurring at well
predictable moments.
The basis for the calculation for the economics of wind
power is laid down by Professor Poul Erik Morthorst of the
Riso DTU, the Technical University of Denmark.
This work has also been published by the EWEA, the
European Wind Energy Association and is available in the following link.
The site
wind-energy-the
facts.org presents this important information as a power point
presentation. This work allows to calculate the cost in money (Eu, $) for
a given installation for the complete life cycle of planning, building,
operation and maintenance, deconstruction and partly also the remediation.
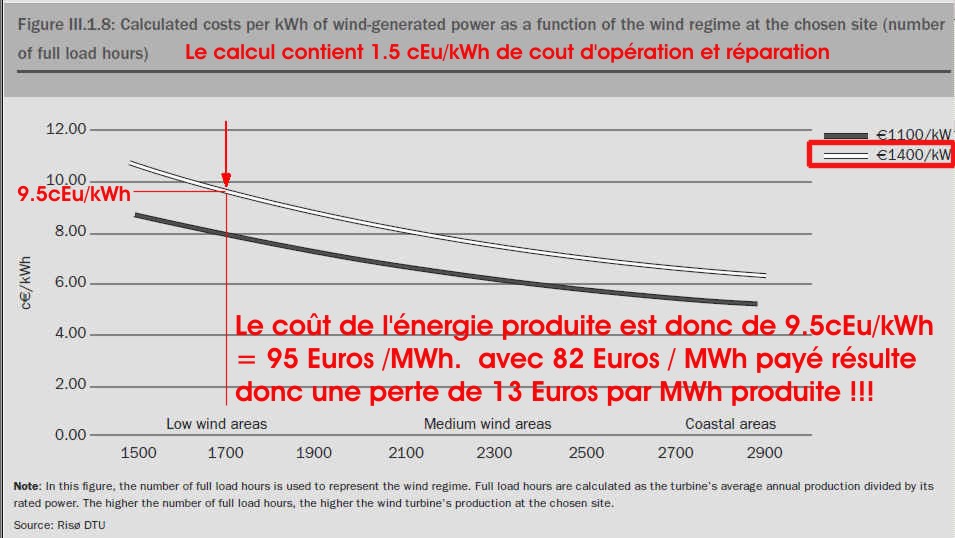
It also allows to calculate the energy cost as a function of
the expected wind regime (low wind area is around 1000 to 1500h) in number of full load hours per year in Euros per
MWh.
Missing in the work of Poul Erik Morthorst, however, is the full life time cycle energy content of the installation (his work permits the investment or money content of the installation). In order to complete Poul Erik Morthorst work, an Ecolo Monetary Model (EMM) is introduced here. This is important, as this permits to calculate the ecological rentability of the installation by allowing a) to calculate to what percentage a given renewal energy source delivers secondary and not primary energy, and b) it allows to calculate how much CO2 was produced by building, operating and removing/remediating the renewable energy installation. Secondary energy is energy produced from another energy source. For instance the electricity produced by burning oil is secondary energy, while the burned oil was primary energy. Not all energy delivered by a "renwable" energy installation is primary energy and the percentage content of secondary energy is indeed a inverse function of the wind regime: the more wind available for a wind turbine, the lower the percentage of secondary energy delivered. It is thus also an ecological crime to build wind farms in low wind regime areas.
The Ecolo Monetary Model (EMM) is based on the idea to use a shortcut for determining the primary energy content of a given installation of known economic price / value. Trying to elucidate the primary energy content on a detailed item per item basis for a given industrial installation would be a highly complex enterprise as all primary energy must be included, but only once for each activity. Indeed a complete list could not be established as it is impossible to know all items. For instance the salary of the construction worker pouring the concrete for the base of the wind turbine is spent again in energy consuming activities. For instance the worker drives to a chopping mall with his car to buy a Christmas tree, but the tree in turn has also been cut with a chain saw and has been transported in a car driven by a person who received a salary again...
The trick is simply to sum up all primary energies, of all known sources produced / consumed on the globe, the whole world, in a single year. These figures of the primary energy consumption by each country and of the whole world are published every year by British Petrol. At the same time the gross world product (GWP), the combined gross national product of all the countries in the world, is published by the International Monetary Fund (IMF) in the World Economic Outlook database. Because imports and exports balance exactly when considering the whole world, this also equals the total global gross domestic product (GDP). Using the two sources we are able to calculate the energy content of a monetary unit such as dollars or Euros. Multiplying the full life cycle monetary cost of a "renewable" energy source with this figure, we can thus estimate the full primary energy content of the installation and therefore also its CO2 footprint and the ration of secondary energy to primary energy of the installation considered.
http://www.wind-energy-the-facts.org/images/6poulerikmorthorstwindpowereconomics.pdf
Français:
La rentabilité économique et écologique des installations d'aero - générateurs
est analysé sur ces pages. Il est démontré que des installations éoliens dans
des régions de vent faibles, comme est le cas pour le sud de la Vienne en France
ne peuvent être profitable ni en termes d'économie, ni en thermes d'écologie.
En effet ces générateurs d'énergie électrique ne produiront de l'énergie que
pendant des conditions météorologiques de forte vents à travers toute l'Europe,
c'est à dire au moment ou la plupart de tous les aero - générateurs déjà
existant à travers toute l'Europe sont en train de produire de l'électricité et
donc au moment ou il y a surproduction d'électricité. Plusieurs études ont en
effet démontré qu'il y a une forte corrélation entre les conditions
météorologiques de fortes vents et la chute des prix d'électricité sur la bourse
EPEX de l'Europe. L'introduction d'un modèle écolo - monetaire sur ces pages
permet en outre de calculer le pourcentage d'énergie secondaire produit par une
telle installation d'énergie prétendue "renouvelable" parce que mal placée
(l'énergie secondaire est la partie d'énergie produite par un générateur
d'énergie qui rembourse seulement l'énergie déjà dépensée/gaspillée pour la
planification, construction, opération/maintenance, déconstruction et remise en
état naturelle de l'installation pendant le cycle de la vie complète).
Il est finalement démontré que l'installation d'aero - générateurs est en
effet un vraiment mauvais choix particulièrement dans un pays comme celle de la
France qui est un des pays les mieux placé pour exploiter les courants sous
marins! La raison principale se trouve dans la différence énorme entre les
densités de l'eau comme comparé a celle de l'air (vent) qui résulte dans un
facteur de plus que 850 et la production d'énergie est bien sur proportionnel à
la densité du fluide qui fait tourner la turbine. Une turbine sous-marin peut en
effet remplacer plus que 850 aero - générateurs de taille comparable et les
courants marins sont en plus constants et prévisible à très long termes.
La fondation pour un calcul de
l'économie des installation de générateurs d'énergie de vent est donné par le
travail du Professoral
Poul Erik Morthorst de la Riso DTU, l'Université
Technique du Denmark. Son travail a aussi été publié par la
EWEA, l'Association Européen de l'Énergie du Vent,
et est accessible en anglais sous le lien ci-dessus. Le site
wind-energy-the
facts.org contient cette information importante en forme de présentation
power point. Cette publication permets d'estimer le coût
en argent (Eu, $) pour une installation donné pour le cycle de vie complet
contenant les phases de projet, construction, opération et manu tance,
déconstruction et en partie la ré médiation du terrain. La ré médiation
devient irréparable si le crime de construire sur des terrains karstique à été
commis! Le travail de Poul Erik Morthorst
permet aussi de calculer le coût de l'énergie produit en
fonction du régime de vent (régime de vents faibles corresponds à environs 1000
to 1500h) en nombres d'heures de puissance maximale par an en Euros par
MWh.
Ce qui manque par contre dans le travail de Poul Erik Morthorst, est une évaluation du contenu de l'énergie du cycle de vie complète de l'installation (son travail ne permet que de calculer le contenu financier, donc monétaire, de l'installation). Pour compléter le travail de Poul Erik Morthorst, un Modèle écolo monétaire (MEM) est Introduit ici. Cela est d'importance car il permet de calculer la rentabilité écologique de l'installation en permettant a) de déterminer le pourcent d'énergie secondaire délivré par une source d'énergie prétendu "renouvelable", et b) cela permet de calculer combien de CO2 à été émis pendant la planification, la construction, l'opération, la manu tance, la démontage, et la ré médiation du terrain de l'installation d'énergie prétendu "renouvelable". L'énergie secondaire est de l'énergie produit à partir d'une autre source d'énergie. Par exemple, de l'électricité produit en brûlant du pétrole est secondaire, pendant que le pétrole brûlé est de l'énergie primaire. Pas toute l'énergie produite par une installation de l'énergie prétendu "renouvelable" est de l'énergie primaire et le pourcentage de l'énergie secondaire, donc "non-renouvlable", est une fonction inverse du régime de vent: plus qu'il y a de vent pour une installation, plus bas le pourcentage d'énergie secondaire, donc "non-renouvlable, de l'énergie livré par cette installation. C'est pour cela qu'une installation éolien dans une une de régime de vent faible est un crime contre le développement durable et la survie de nôtre planète!
Le Modèle Écolo Monétaire (MEM) est ancré sur une idée de "raccourci" pour évaluer le contenu d'énergie primaire d'une installation de prix économique connu. Il est sans espoir d'essayer de calcule ce contenu en considérant tous les parts et activités nécessaires pour réaliser une telle installation, car bien trop complexe et plein de facteurs impossible d'évaluer. Je donne un exemple: le salaire de la personne qui coule le béton pour construire la base de l'éolienne est en partie de nouveau dépensé en activités qui eux aussi amènent une consommation d'énergie. Par exemple notre ouvrier de construction se balade avec sa voiture pour acheter un arbre de Noël dans un centre commercial, et cet arbre était coupé avec une scie thérmique et était aussi transporté dans un camion par une pérsonne qui a aussi été payé un salaire...
La combine est de simplement faire la somme de tous les énergies primaires produits / consommés de tous le sources et tous les pays du globe pendant une seule année. Ces chiffres de la consommation des énergies primaires de tous les pays et de la terre sont publiées chaque année par British Pétrole. De même on peut trouver le Produit Domestique Globale (PDG) et les produits nationaux combinés de tous les pays du monde sont publiés dans la base de données "World Economic Outlook" du Fonds Monétaire International (FMI). Comme imports et exports se compensent exactement en considérant le globe entier, ces chiffres sont identiques avec le total du Produit Domestique Mondiale (PDM). Ces deux sources nous permettent donc de calculer le contenu en énergie primaire d'un dollar ou d'un Euro dépensé. Multiplier le contenu financier, donc le coût total d'une installation d'énergie prétendu "renouvelable" pour son cycle de vie complète avec cette chiffre permet donc d'estimer le contenu en énergie primaire de cette installation, son bilan CO2, et de calculer le pourcentage en énergie secondaire dans l'énergie produit par cette installation.
| Ecolo Monetary Model |
Modèle écolo monétaire
|
||||||||||||||||||||||||||||||||||||||||||||||||||||||||||||||||||||||||||||||||||||||||||||||||||||||||||||||||||||||||||||||||||||||||||||||||||||||||||||||||||||||||||||||||||||||||||||||||||||||||||||||||||||||||||||||||||||||||||||||||||||||||||||||||||||||||||||||||||||||||||||||||||||||||||||||||||||||||||||||||||||||||||||||||||
| figures of the primary energy consumption by each country and of the whole world | |||||||||||||||||||||||||||||||||||||||||||||||||||||||||||||||||||||||||||||||||||||||||||||||||||||||||||||||||||||||||||||||||||||||||||||||||||||||||||||||||||||||||||||||||||||||||||||||||||||||||||||||||||||||||||||||||||||||||||||||||||||||||||||||||||||||||||||||||||||||||||||||||||||||||||||||||||||||||||||||||||||||||||||||||||
| combined gross national product of all the countries in the world | |||||||||||||||||||||||||||||||||||||||||||||||||||||||||||||||||||||||||||||||||||||||||||||||||||||||||||||||||||||||||||||||||||||||||||||||||||||||||||||||||||||||||||||||||||||||||||||||||||||||||||||||||||||||||||||||||||||||||||||||||||||||||||||||||||||||||||||||||||||||||||||||||||||||||||||||||||||||||||||||||||||||||||||||||||
|
EXCEL-SPREADSHEET / FISHIER EXCEL DÉTAILLÉ ecolo_monetary_model.xls |
|||||||||||||||||||||||||||||||||||||||||||||||||||||||||||||||||||||||||||||||||||||||||||||||||||||||||||||||||||||||||||||||||||||||||||||||||||||||||||||||||||||||||||||||||||||||||||||||||||||||||||||||||||||||||||||||||||||||||||||||||||||||||||||||||||||||||||||||||||||||||||||||||||||||||||||||||||||||||||||||||||||||||||||||||||
|
|||||||||||||||||||||||||||||||||||||||||||||||||||||||||||||||||||||||||||||||||||||||||||||||||||||||||||||||||||||||||||||||||||||||||||||||||||||||||||||||||||||||||||||||||||||||||||||||||||||||||||||||||||||||||||||||||||||||||||||||||||||||||||||||||||||||||||||||||||||||||||||||||||||||||||||||||||||||||||||||||||||||||||||||||||
 |
|||||||||||||||||||||||||||||||||||||||||||||||||||||||||||||||||||||||||||||||||||||||||||||||||||||||||||||||||||||||||||||||||||||||||||||||||||||||||||||||||||||||||||||||||||||||||||||||||||||||||||||||||||||||||||||||||||||||||||||||||||||||||||||||||||||||||||||||||||||||||||||||||||||||||||||||||||||||||||||||||||||||||||||||||||
|
|
||||||||||||||||||||||||||||||||||||||||||||||||||||||||||||||||||||||||||||||||||||||||||||||||||||||||||||||||||||||||||||||||||||||||||||||||||||||||||||||||||||||||||||
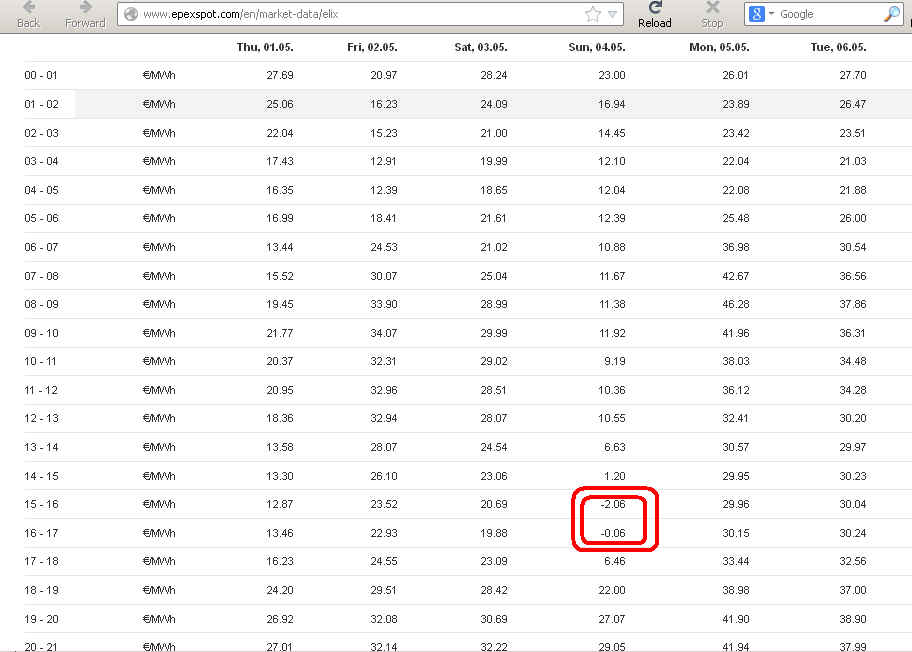
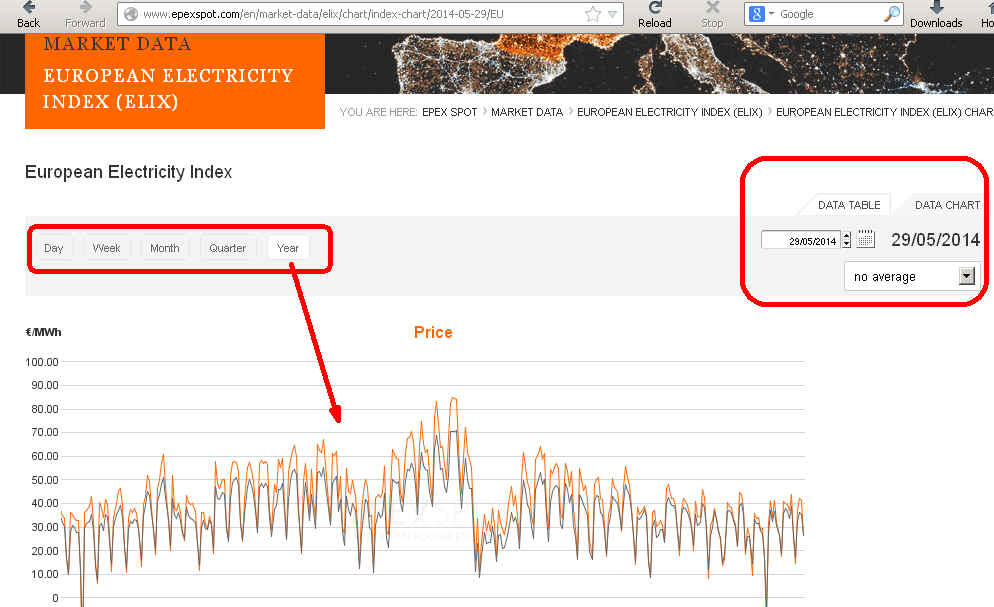
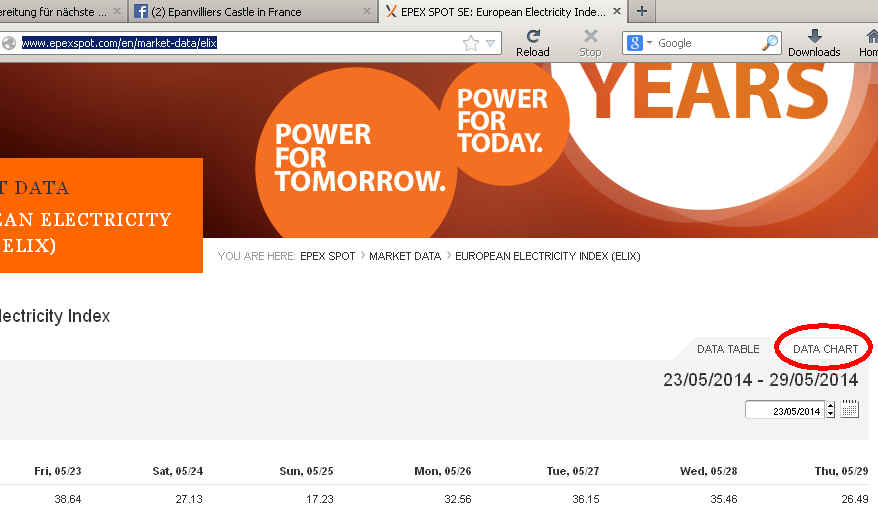
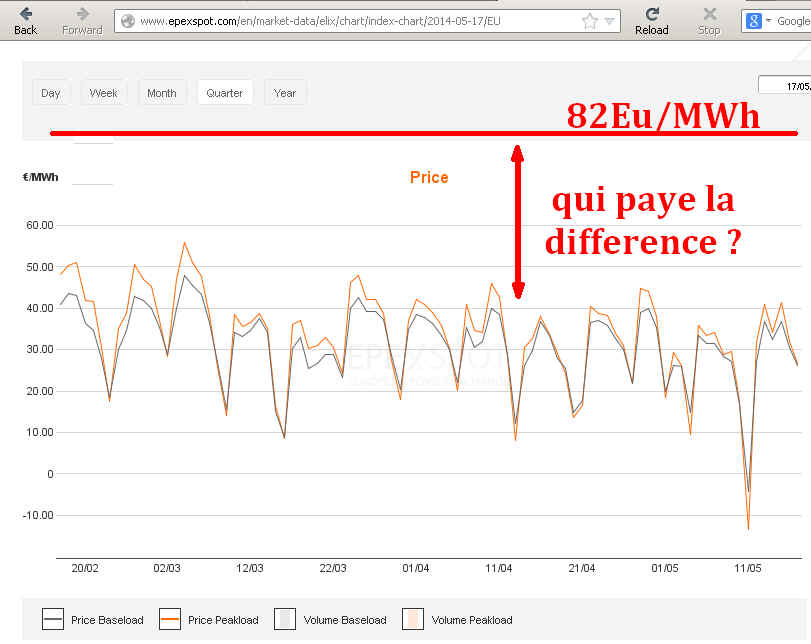
| Market prices are for Europ
made at the EPEX spot price stock
exchange Here you can have a look at the real energy prices! All payd over this is distortion of free marked exchange and has to be procecuted by the international regulators! For further statistical data see also: http://ec.europa.eu/energy/observatory/trends_2030/index_en.htm |
Pour l'Europe les prix de l'électricité
sont déterminés sur l'EPEX la bourse
du prix spot de l'énergie électrique C'est ici que vous pouvez voir les vrai prix payé pour l'énergie électrique! Tout prix payé au delà ces prix du marché libre sont considérés comme manipulation du marché par subvention de l'énergie et sont justiciables! Pour des donnés statistiques voir aussi: http://ec.europa.eu/energy/observatory/trends_2030/index_en.htm |
 |
 |
 |
 |
|
|
|
|
Strong correlation of weather patterns accross
Europe results in simultaneaous wind farm energy and thus decreasing
prices of electricity on EPEX, the European Energy market place.
It is for this reason specialy stupid to build windfarms in
in low wind regime areas.
Considering the energy spent . It is thus also an ecological crime to
build wind farms in low wind regimes, considering the energy spent for
the installation and CO2 emitted, as found by the Ecolo Monetary Model. http://www.poyry.com/sites/default/files/imce/files/intermittency_-_march_2011_-_energy.pdf "By 2030 wholesale market prices in some countries will have become highly volatile and driven by short term weather patterns" "Understanding the availability of wind turbines (WT) is vital to maximise WT energy production and minimise the payback period. Previous work tended to concentrate on the location of unreliability or failure modes in a WT. This paper investigates the influence of weather and location on WT failure rate and downtime" http://www.claverton-energy.com/wordpress/wp-content/files/sinden06-windresource.pdf "Patterns of wind power availability are presented, with the data demonstrating that the output from large-scale wind power development in the UK has distinct patterns of monthly and hourly variability." |
Une corrélation prononcé à été
trouvé pour les systèmes climatiques en Europe qui résulte en
corrélation des vents à travers le continent. Cela résulte en
production d'énergie de vent simultané à travers toute l'Europe et donc
dans une surproduction d'électricité qui fait chuter les prix à la
bourse EPEX. C'est cet effet qui rend particulièrement stupide de
construire des installation d'Aérogénérateurs dans des zones de vents
faibles! En effet de telles installations sont un crime écologique en
considérant l'énergie dépensé et le CO2 émis, comme déterminé par le
Modèle écolo monétaire décris ci-dessus.
http://www.poyry.com/sites/default/files/imce/files/intermittency_-_march_2011_-_energy.pdf
http://www.supergen-wind.org.uk/docs/publications/Tavner,%20Gindele,%20Faulstich,%20Hahn,%20Whittle,%20Greenwood-EWEC2010.pdf
http://www.claverton-energy.com/wordpress/wp-content/files/sinden06-windresource.pdf |
|
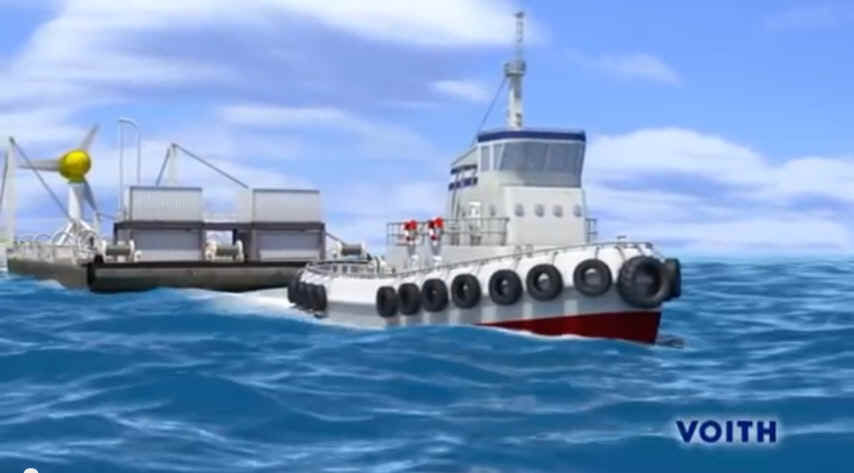
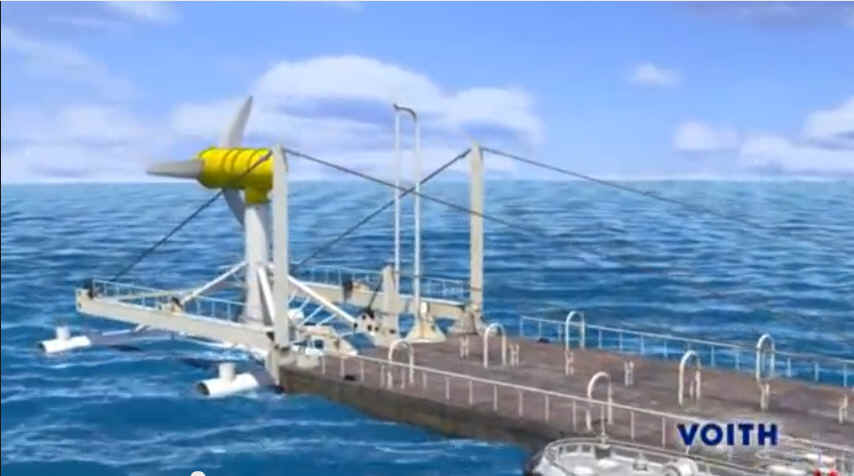
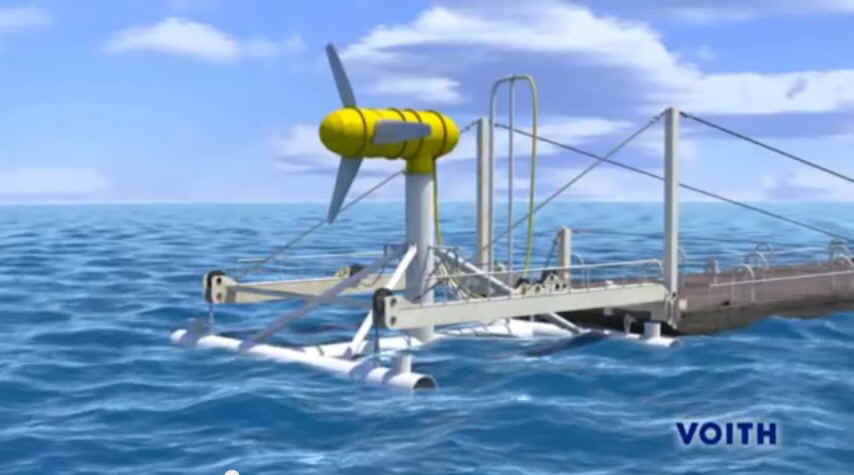
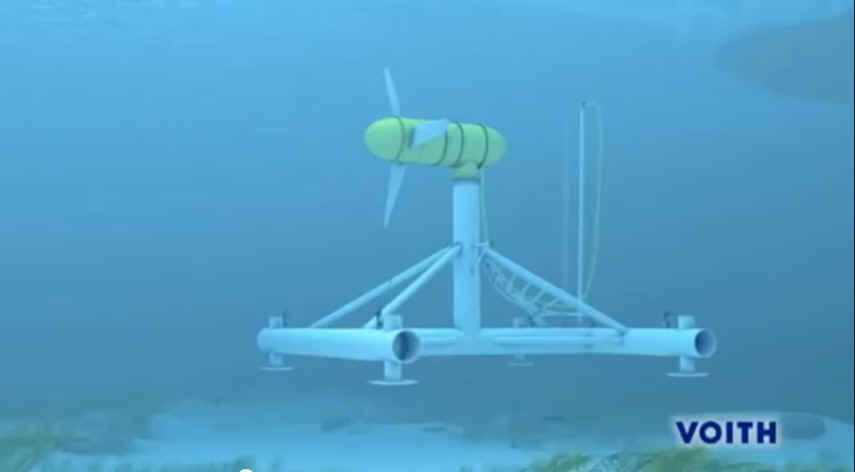
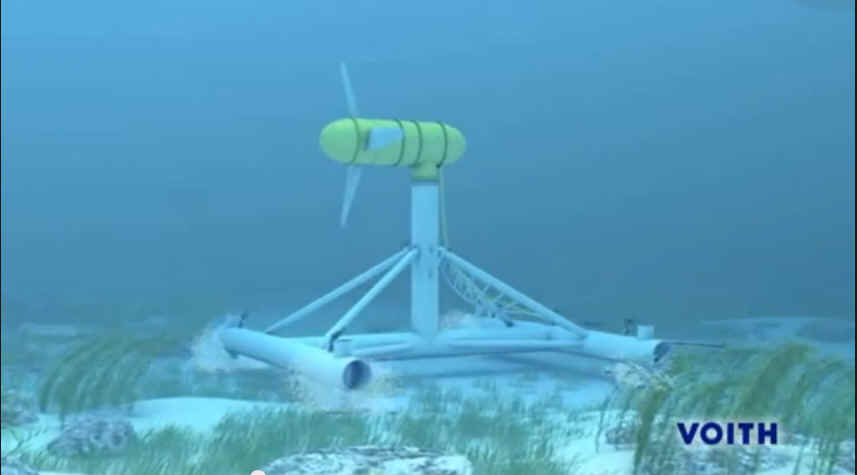
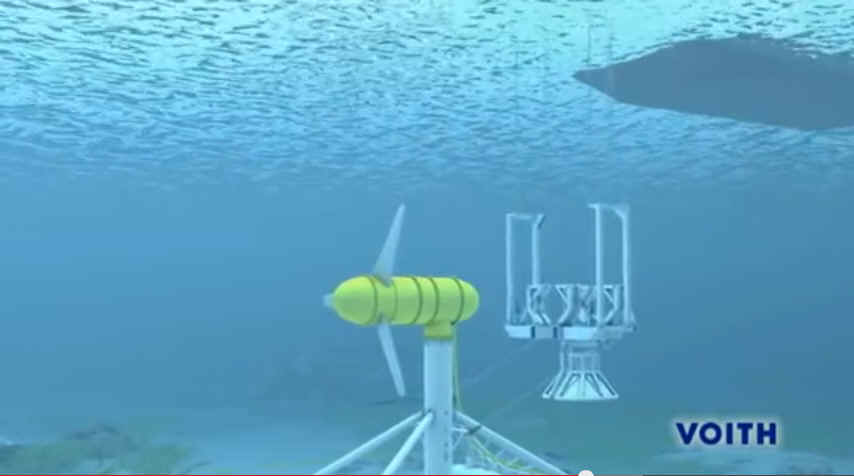
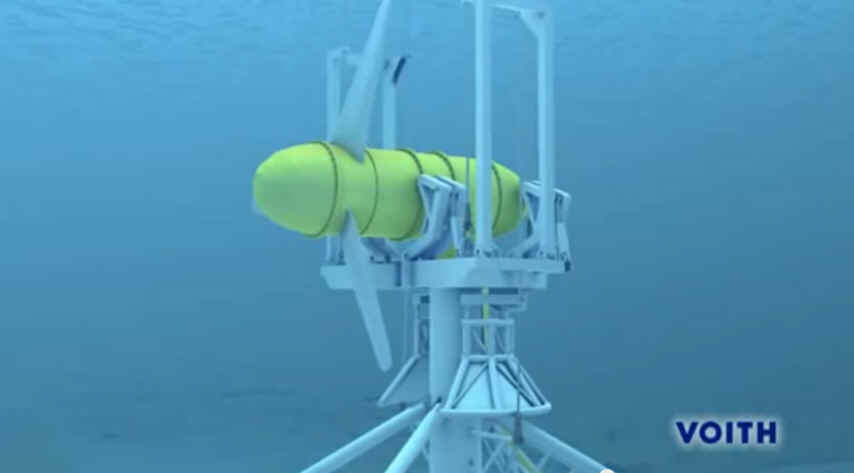
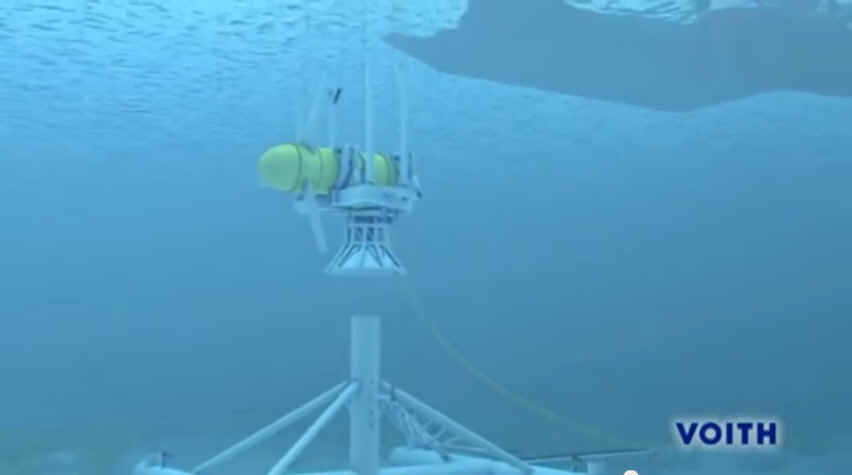
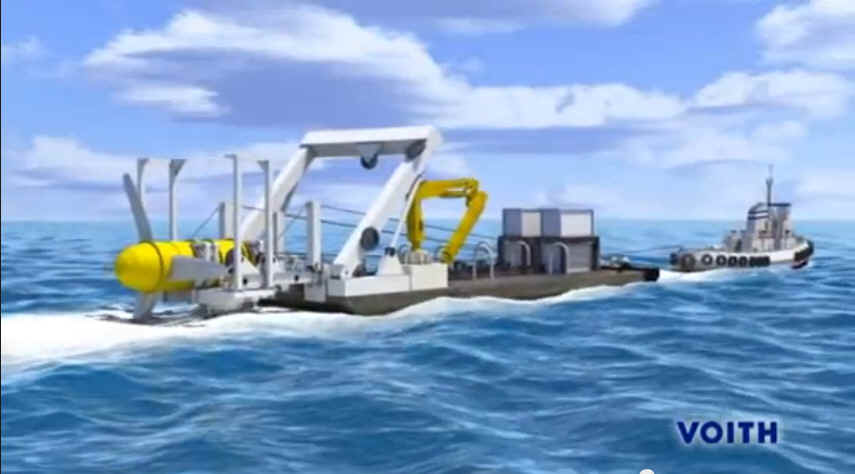
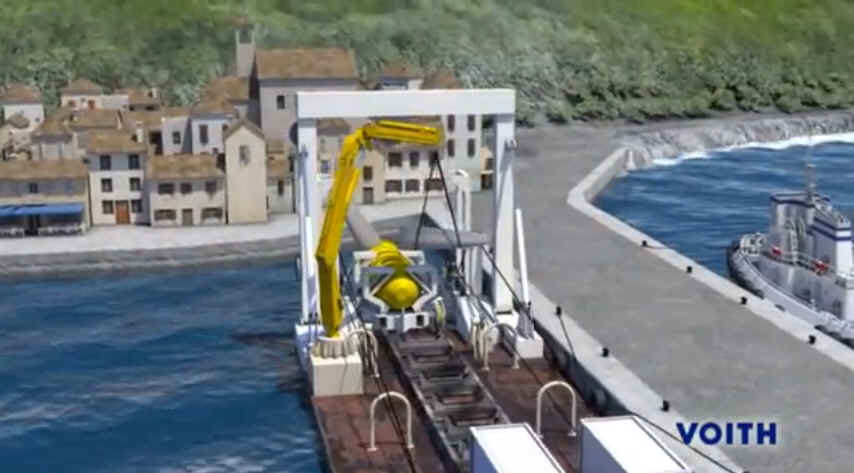
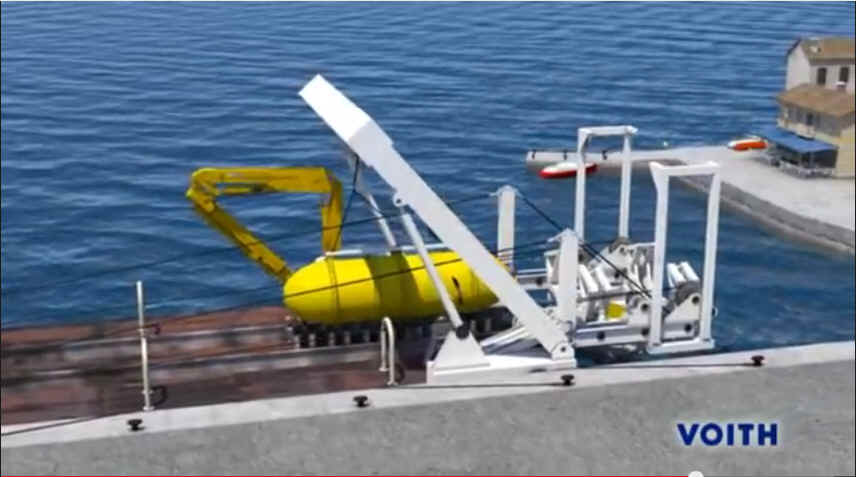
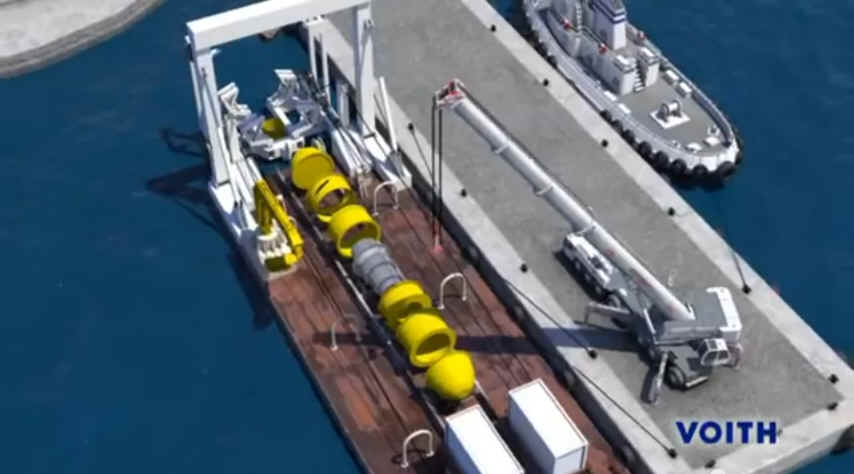
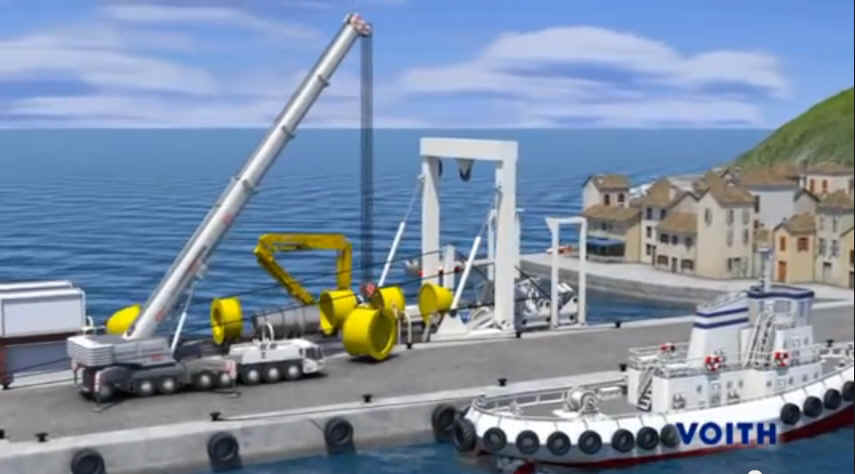
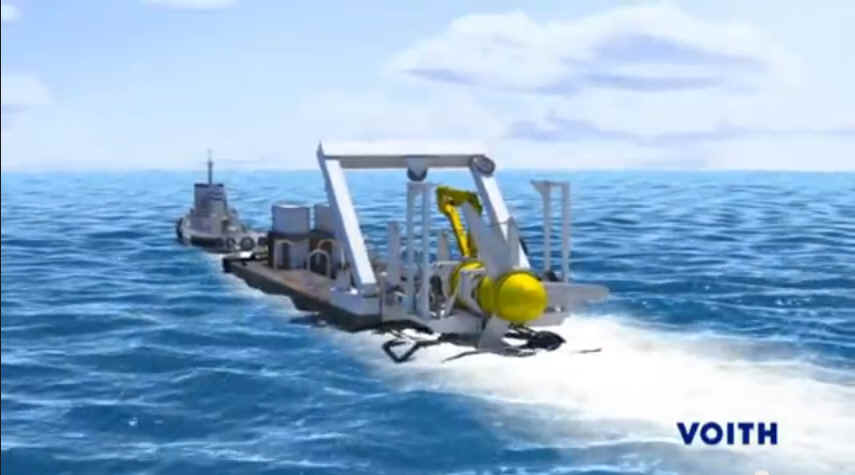
The future is in water |
Le futur est dans l'eau |
| Air-Water density ratio from
CRC-Handbookof Chemistry and Physics CRC F-11 Mod.Phys 52, part II,s33, 1980 Air at 20 degrees C, 760mm HG dA= 1.204 mg/cm3 = 1.204 x 10⁻³ g/cm3 F-3 Selected from Smithonian Tables Sea Sea water dW = 1.025 gm/cm3 at 15 degrees C Density Ratio Water / Air = dW/dA = 1.025/0.001204 = 851.328 (up to 875) Thus One waterturbine can replace 850 Windturbines (sous certains conditions 875) France has chosen the wrong approach in their program of energy transition! France is the best placed country to make use of undersee currents and exploit this maritime energy. We are here not talking about see barragues but well of underwater currents. One has to understand that the water density is with 1.025 gm/cm3 more dense by a factor of 850 than the density of air with 0.001204 g/cm3. There is thus 850 times more energy in the water than in air and one underwater turbine can replace 850 wind turbines of the same size! In addition the energy delivery of a water turbine can be predicted precisely for centuries of years ahead. Last underwater turbines are a fine measure to block destructive sea ground damaging industrial fishing
https://www.youtube.com/watch?v=8-sFLGMSMac |
Fraction de densité air - eau selon le CRC-Handbookof
Chemistry and Physics CRC F-11 Mod.Phys 52, part II,s33, 1980 Air à 20 degrees C, 760mm HG dA= 1.204 mg/cm3 = 1.204 x 10⁻³ g/cm3 Sélection F-3 des tables Smithonian L'eau de la mer dE = 1.025 gm/cm3 à 15 degrés C Fraction de densité Eau / Air = dE/dA = 1.025/0.001204 = 851.328 (à 875) Une turbine d'eau peut donc remplacer 850 éoliennes (sous certain conditions 875) La France fait fausse route dans son programme de l’énergie renouvelable! La France est le pays du monde le mieux placé pour exploiter l’énergie marémotrice, c'est à dire l’énergie des courants maritimes. Il faut comprendre que l'eau a une densité de 1.025 gm/cm3, a comparer avec 0.001204 g/cm3. Il y a donc 875 fois plus d’énergie dans l'eau que dans l'air et une turbine sous-marin peut remplacer 850 éoliennes! En plus la production d’énergie d'une turbine des courants maritimes peut être prédit pour des années dans le futur. Des turbines sous-marins sur le fond empêchent aussi la pêche industrielle qui endommage ¨les sols de la mer.
https://www.youtube.com/watch?v=8-sFLGMSMac
|
|
|
|
 |
 |
 |
 |
 |
 |
 |
 |
 |
 |
 |
 |
 |
 |